Overview
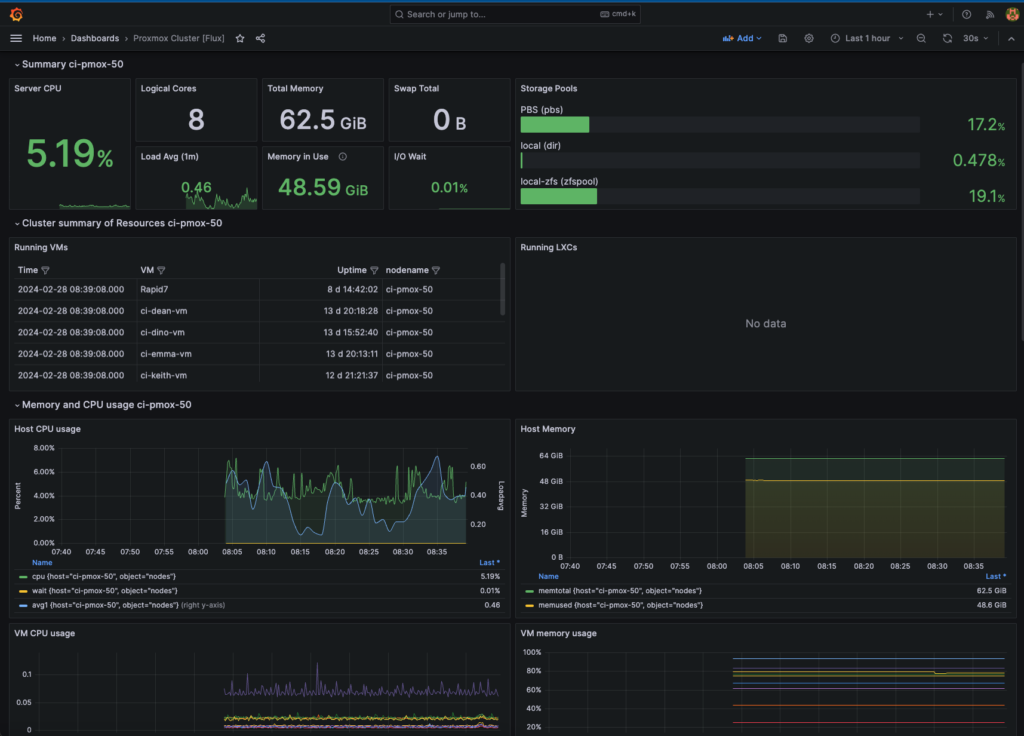
After Testing this Proxmox Cluster Monitoring Dashboard with InfluxDB and Grafana on a Docker Compose Container and finding it worked really well until the container was rebooted as it lost all its InfluxDB settings even though it was configured with persistent disks, I decided to create a new Proxmox LXC Ubuntu 22.04 container and permanently install and configure InfluxDB and Grafana to make the monitoring solution way more stable for a Production Environement.
After installing a standard Ubuntu 22.04 Proxmox LXC container. I did the following to setup my monitoring solution for my Production monitoring solution:
Initial Container Setup
After your container is installed and booted up there are some inital setup steps that need doing before we can start installing out monitoring system. These are:
Update apt by running:
apt updateUpgrade Ubuntu by running:
apt upgrade -yNext install vim and gpg by running:
apt install vim gpgType y and enter to install:

Once the install finishes we need to edit the sshd_config to allow root ssh access so that we can ssh to the container by running:
vim /etc/ssh/sshd_configFind the #PermitRootLogin prohibit-password line:

Change it to PermitRootLogin yes :

Save the changes and you should now be able to ssh to the container from your local machine:

Install InfluxDB
Now that the Container is all setup we can install the InfluxDB which will be used to save the monitoring information from the Proxmox cluster. Unfortunately there is no InfluxDB installer natively in apt so we habe to manually add the repo with gpg and then install it as follows:
Run the following command to download the key for the custom repos:
wget -q https://repos.influxdata.com/influxdata-archive_compat.keyAdd the key with:
echo '393e8779c89ac8d958f81f942f9ad7fb82a25e133faddaf92e15b16e6ac9ce4c influxdata-archive_compat.key' | sha256sum -c && cat influxdata-archive_compat.key | gpg --dearmor | sudo tee /etc/apt/trusted.gpg.d/influxdata-archive_compat.gpg > /dev/nullAdd the repo to apt by running:
echo 'deb [signed-by=/etc/apt/trusted.gpg.d/influxdata-archive_compat.gpg] https://repos.influxdata.com/debian stable main' | sudo tee /etc/apt/sources.list.d/influxdata.listUpdate the package list with:
sudo apt-get updateInstall Influxdb2 with the following command:
sudo apt-get install influxdb2 -y
When the installation finishes check the version by running:
influx versionIt should show the version of Influxdb:

Start the service by running:
sudo systemctl start influxdbEnable InfluxDB as a service by running:
sudo systemctl enable influxdbAllow access to port 8086 by running:
sudo ufw allow 8086/tcpHere are some useful commands for Influxdb:
Show current status by running:

sudo service influxdb status

Restart by running:

sudo service influxdb restart

Stop by running:

sudo service influxdb stop

Start by running:

sudo service influxdb start
Configure InfluxDB
To configure InfluxDB connect to the Container in a browser with http://hostIP:8086
Click on GET STARTED:
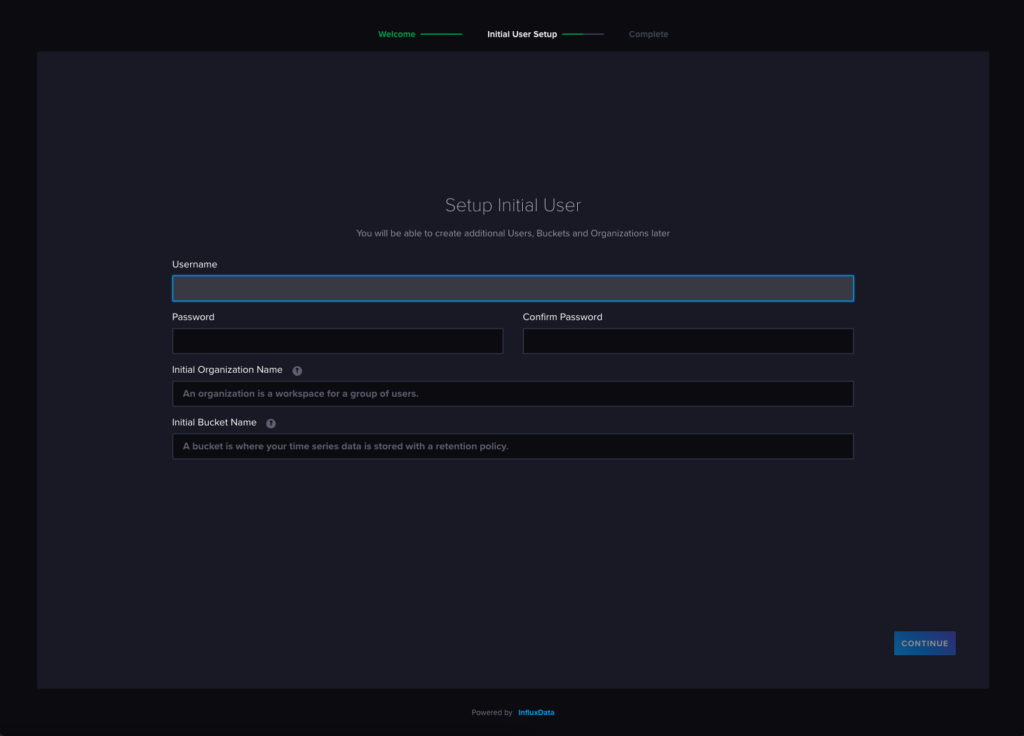
Enter the details asked for and click CONTINUE:
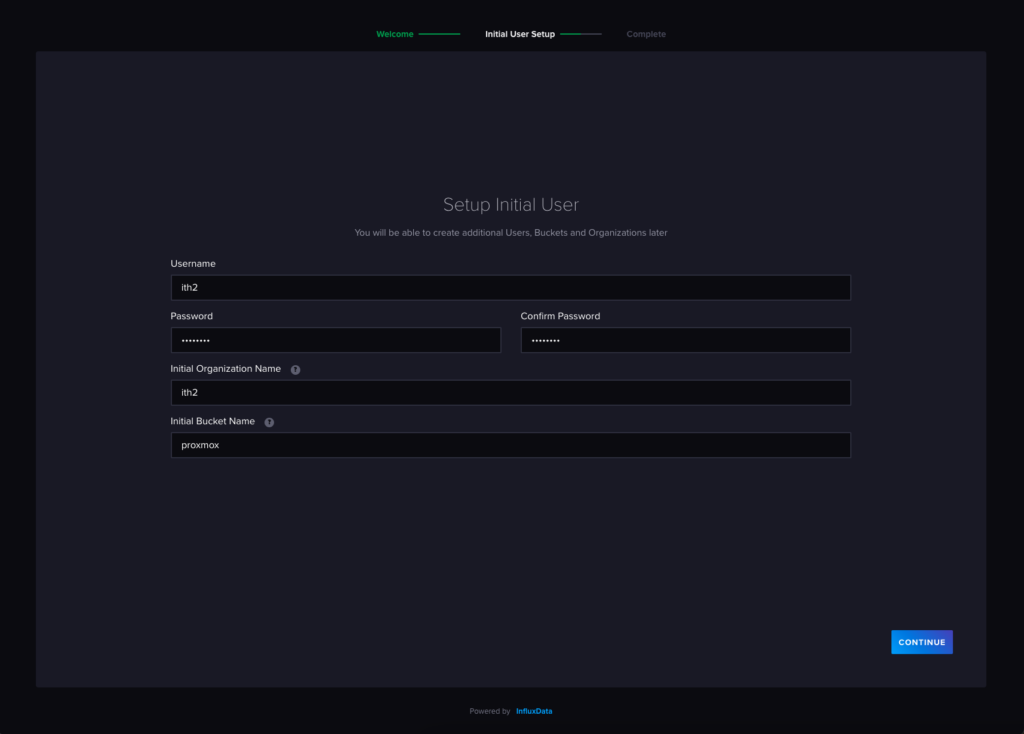
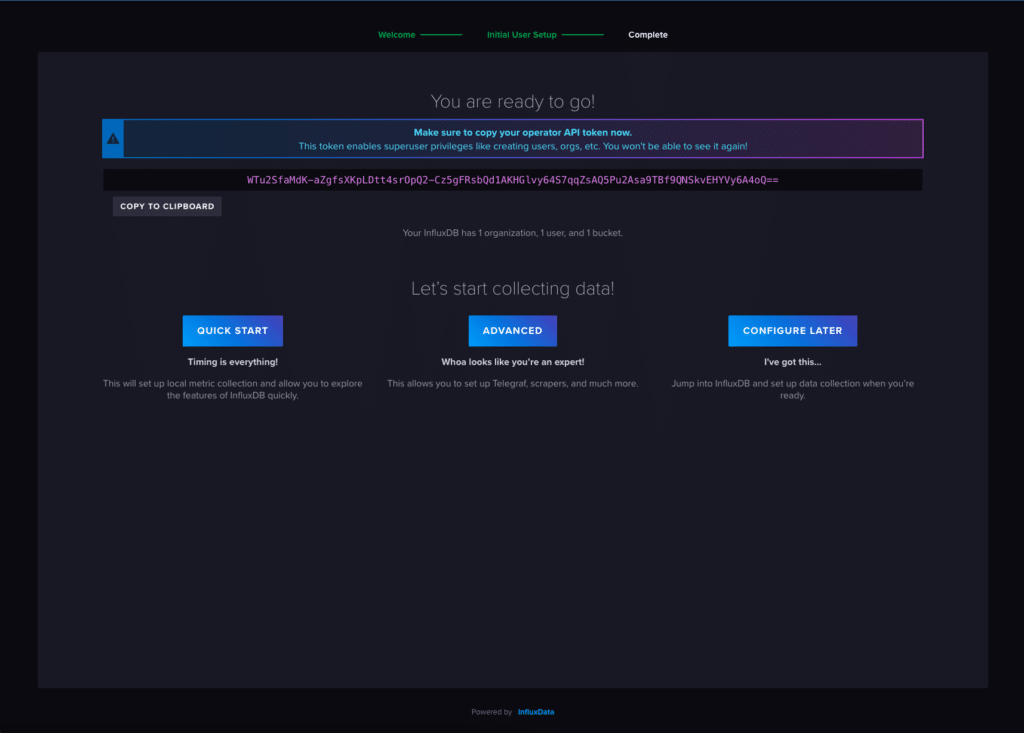
This will create a user for you. Copy the API Token for the use and save it somewhere safe as it will be needed later (this screen print is from an old install so not in use any more!):
Setting up InfluxDB within Proxmox
Open the Proxmox Cluster Gui and click on Datacenter (ci-ha-cluster)on the left hand menu, Click on Metric Server and Add:
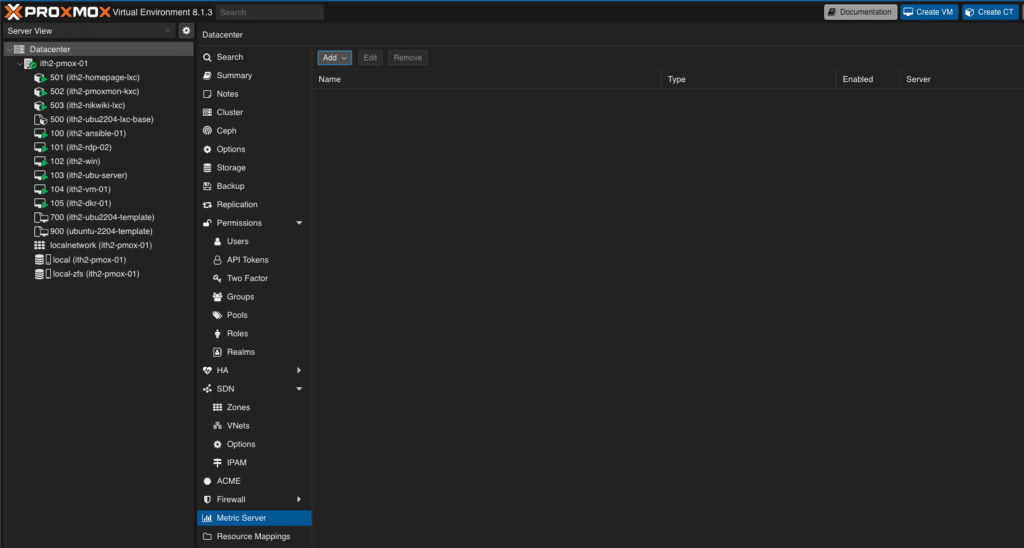
Select InfluxDB:

Add the details and API Token created when setting up InfluxDB before and click Create:
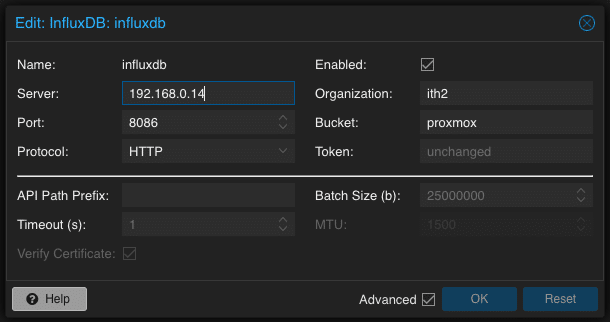
The new access will be shown in the right hand window:

Now we need to test that Proxmox is connected to InfluxDB correctly so go back to influxdb in your browser (<hostIP>:8086):
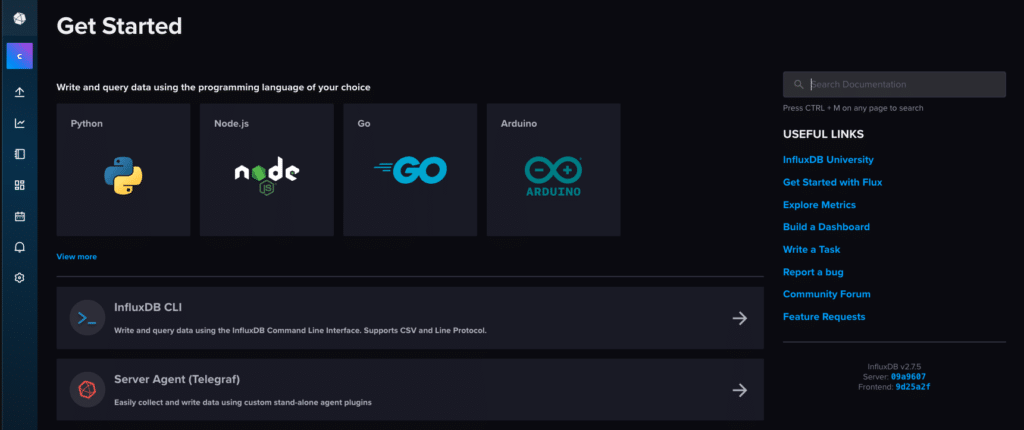
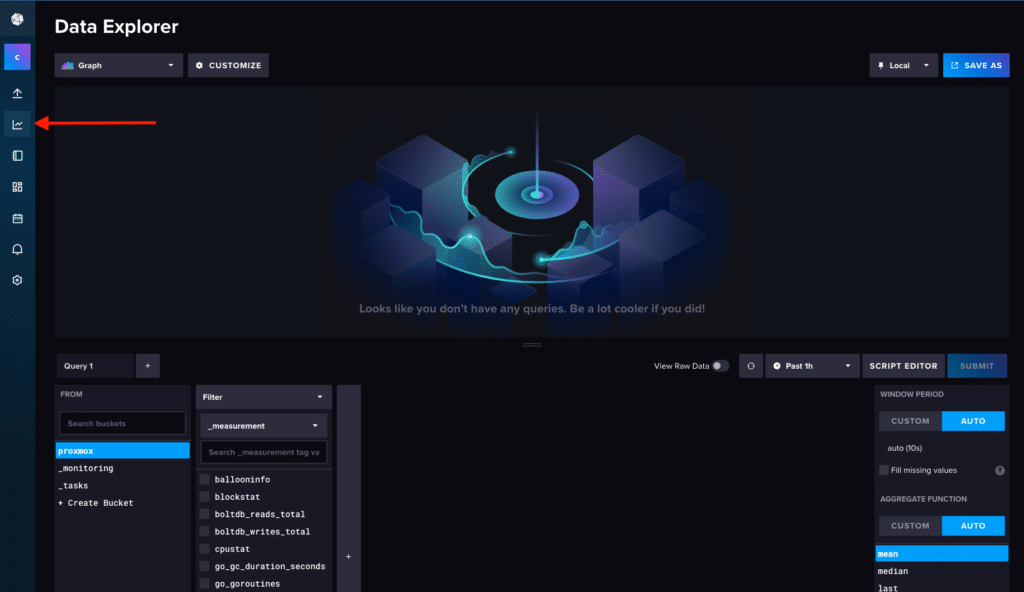
Click on the icon that looks like a graph to open the Data Explorer page:
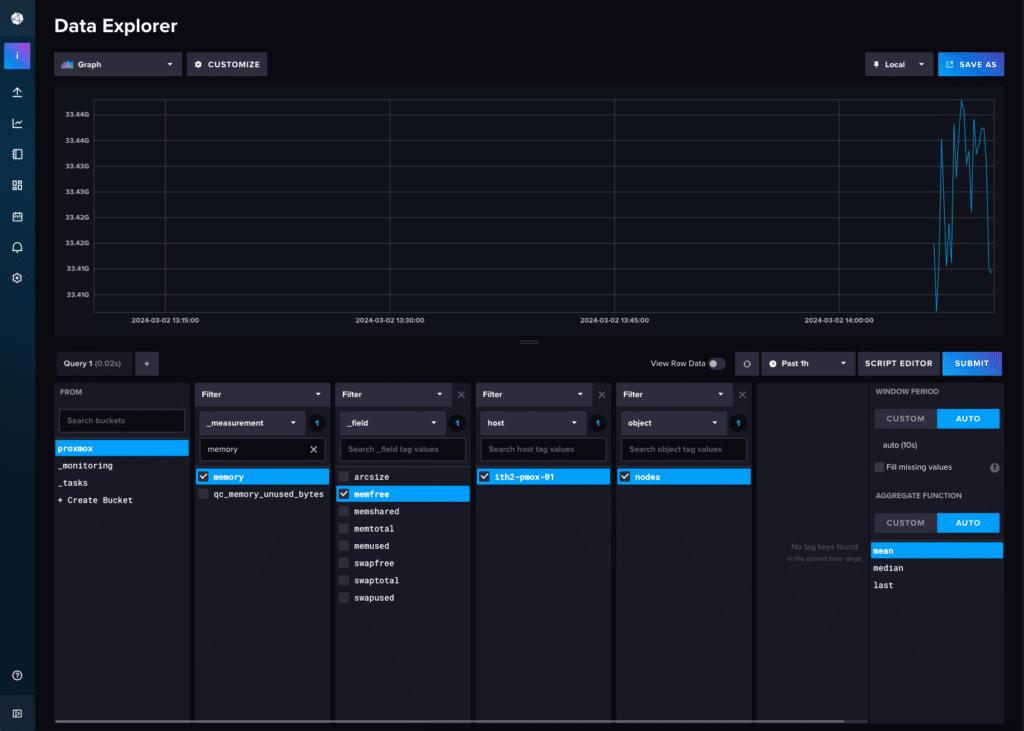
Setup the query as below and click SUBMIT to test that there is a graph shown with data in it. If it is then we are good to move on:
Install Grafana
Back on the server ssh Install the prerequisite packages needed to install Grafana by running:
sudo apt-get install -y apt-transport-https software-properties-common wgetMake the /etc/apt/keyrings folder by running:
sudo mkdir -p /etc/apt/keyrings/Import the GPG key:
wget -q -O - https://apt.grafana.com/gpg.key | gpg --dearmor | sudo tee /etc/apt/keyrings/grafana.gpg > /dev/nullTo add a repository for stable releases, run the following command:
echo "deb [signed-by=/etc/apt/keyrings/grafana.gpg] https://apt.grafana.com stable main" | sudo tee -a /etc/apt/sources.list.d/grafana.listTo add a repository for beta releases, run the following command:
echo "deb [signed-by=/etc/apt/keyrings/grafana.gpg] https://apt.grafana.com beta main" | sudo tee -a /etc/apt/sources.list.d/grafana.listUpdate Apt by running:
sudo apt-get updateInstall Grafana:
apt-get install grafana -yStart the Grafana server with systemd
Run the following commands to start the Grafana service:
sudo systemctl daemon-reload
sudo systemctl start grafana-server
sudo systemctl status grafana-server
Configure the Grafana server to start at boot using systemd
To configure the Grafana server to start at boot, run the following command:
sudo systemctl enable grafana-server.serviceConfiguring Grafana
Next connect to the Graphana Server using a browser using http://<hostIP>:3000:
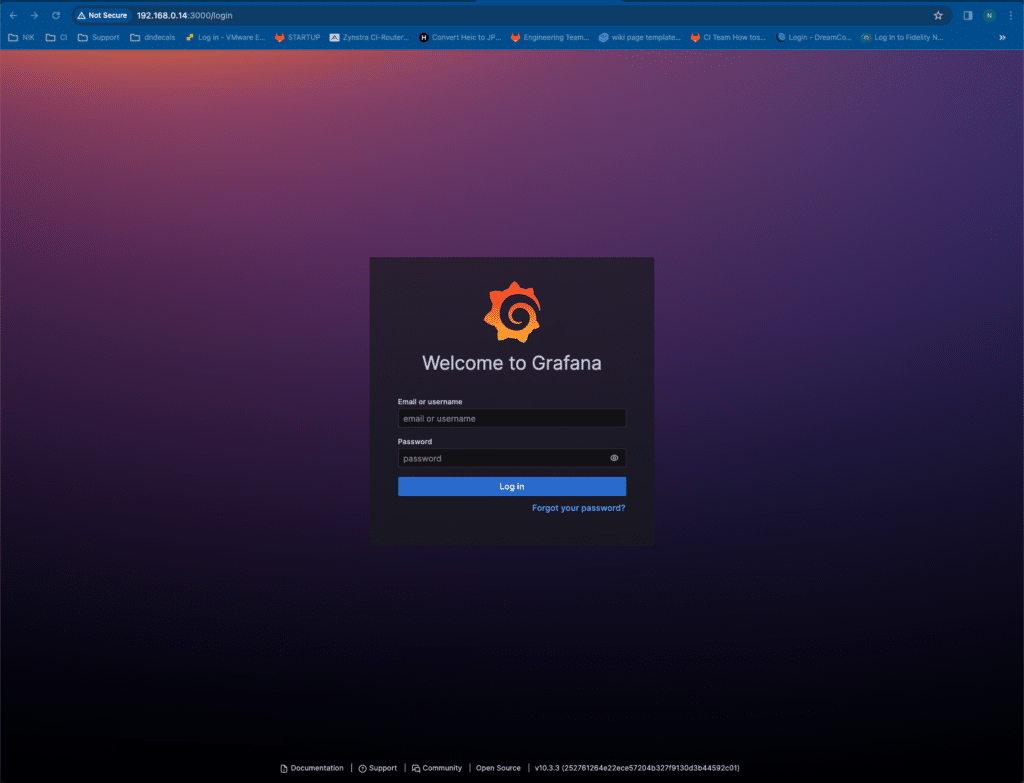
Login as admin/ admin:
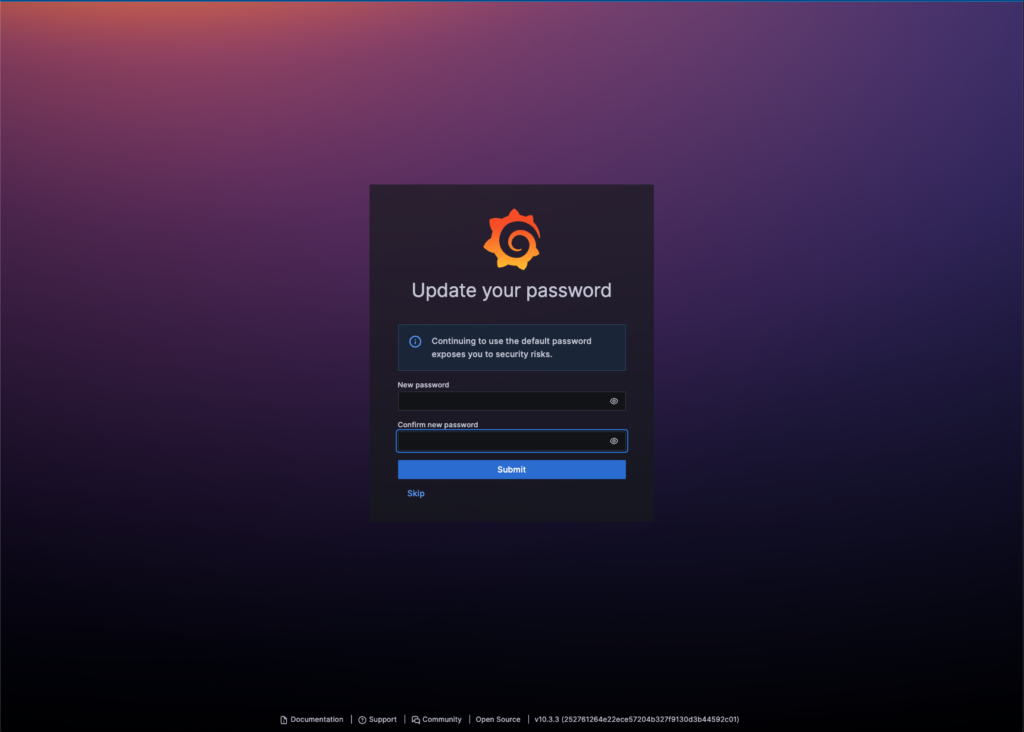
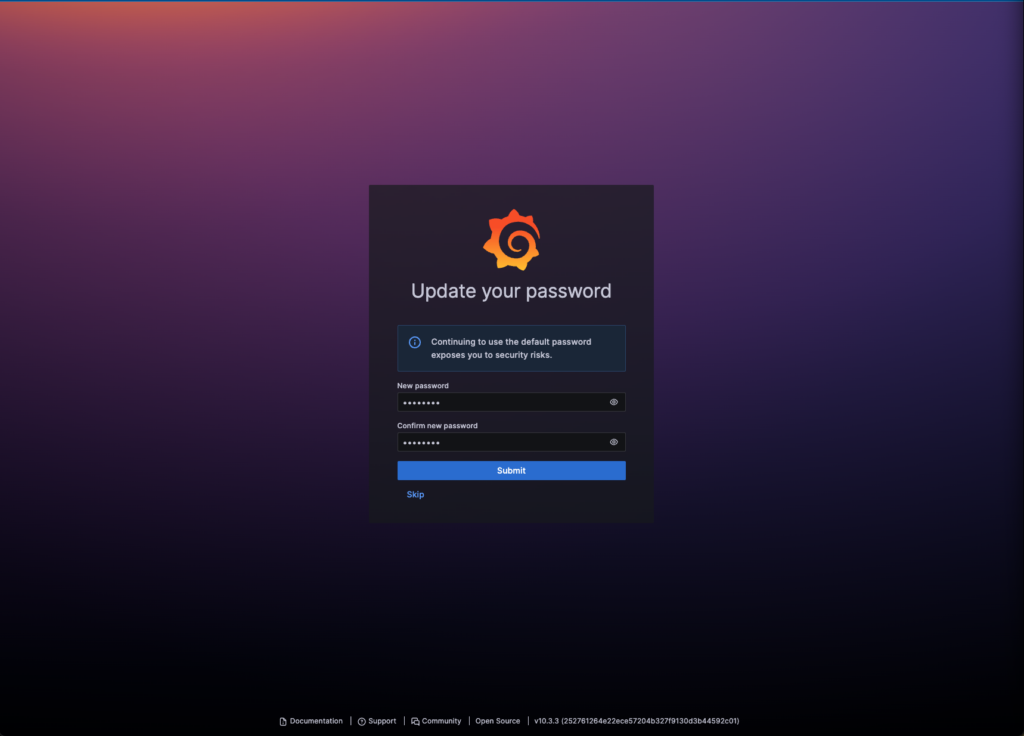
Change the admin user password to the default password and click Submit:
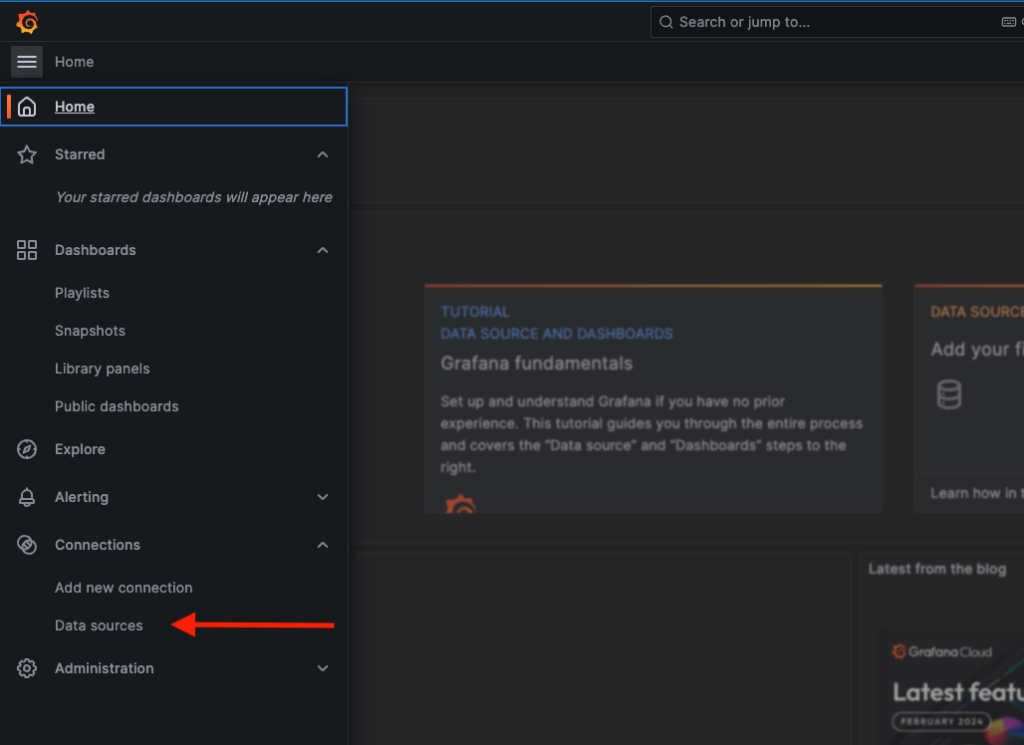
Click on the three lines on the top left hand corner and select Data Sources:
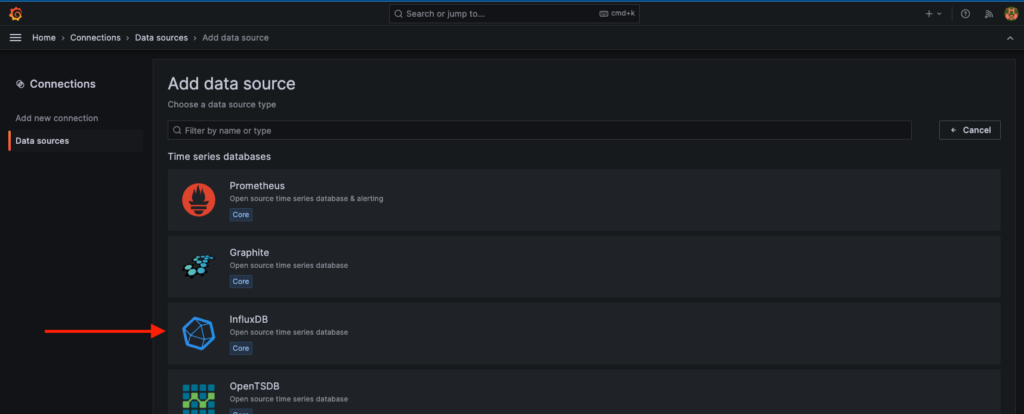
Click Add data Source:

Click on InfluxDB:
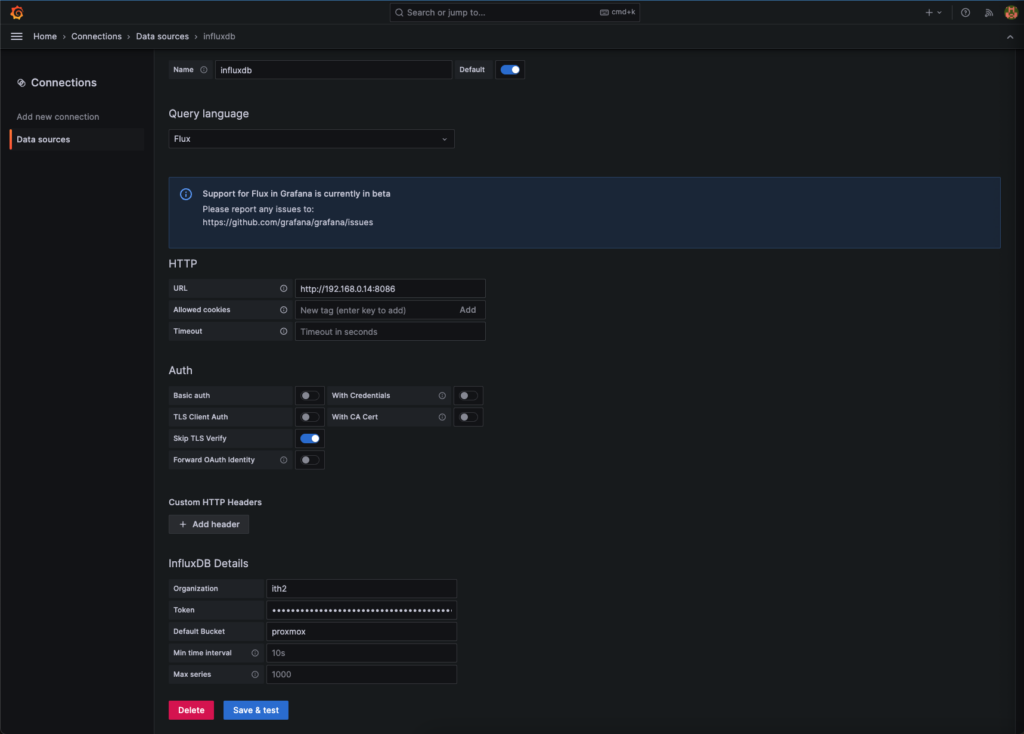
If successful you will see the following message:

Querying and Visualising Data in Grafana
Now that Proxmox is feeding into InfluxDB and InfluxDB is linked up with Grafana, we are ready to start querying data from the database and visualizing it with Grafana!
With us having chosen to use the Flux language, you will want to use dashboard that someone has already made in order to visualise your data.
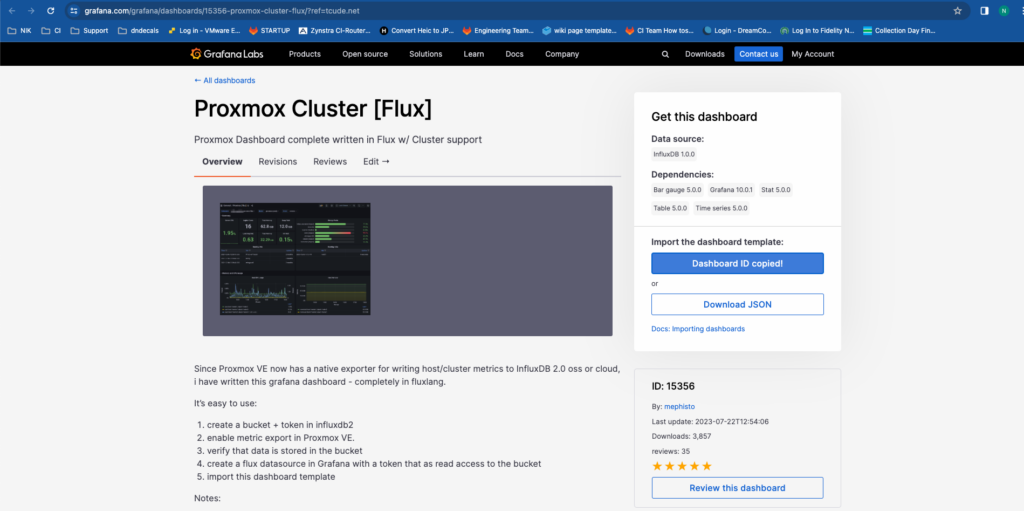
The dashboard ID is:
15356In the Grafana Gui click on the menu icon (3 lines stacked on top of each other) and select Dashboards:
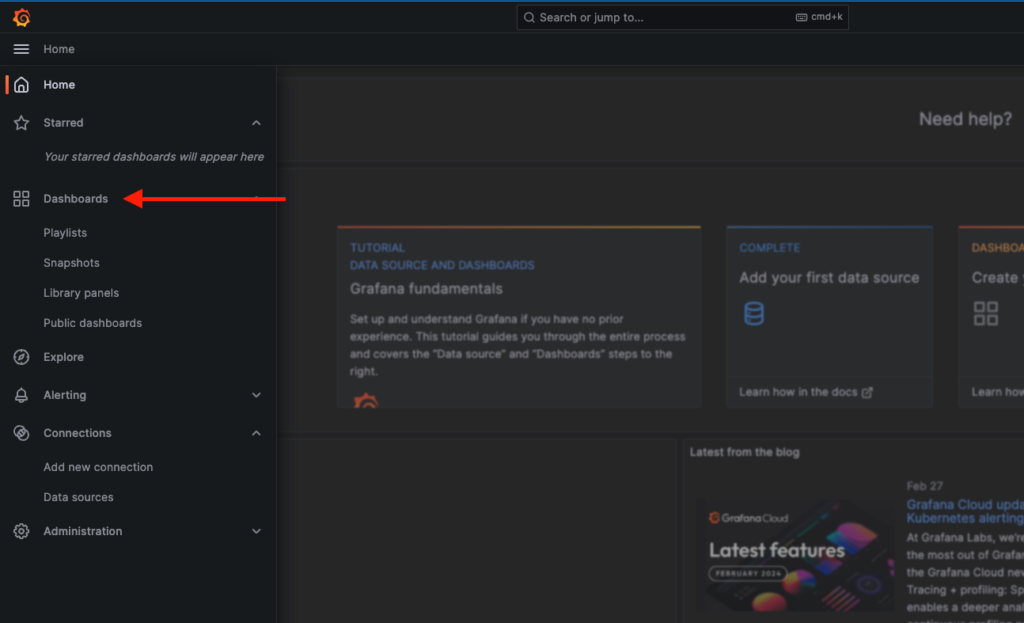
Click on Create Dashboard:

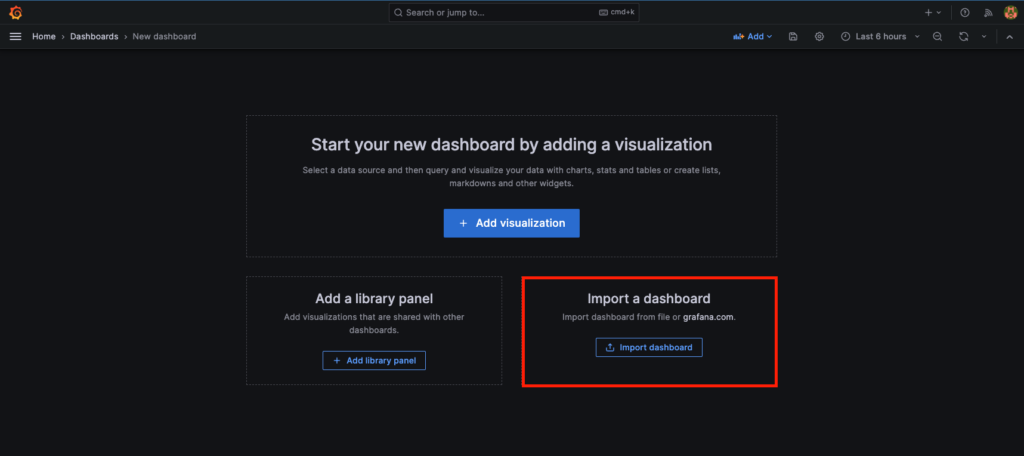
Click on Import dashboard:
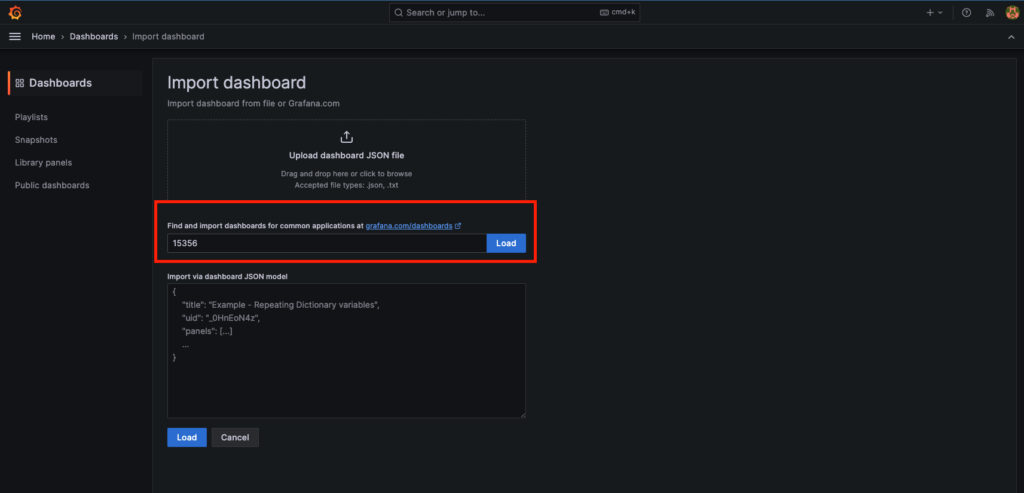
Paste the dashboard ID that we got earlier into the import dashboard field and press the Load button to the right of the import dashboard field:
Select the influxdb in the proxmox-flux field and press Import:

The dashboard will now be propagated:
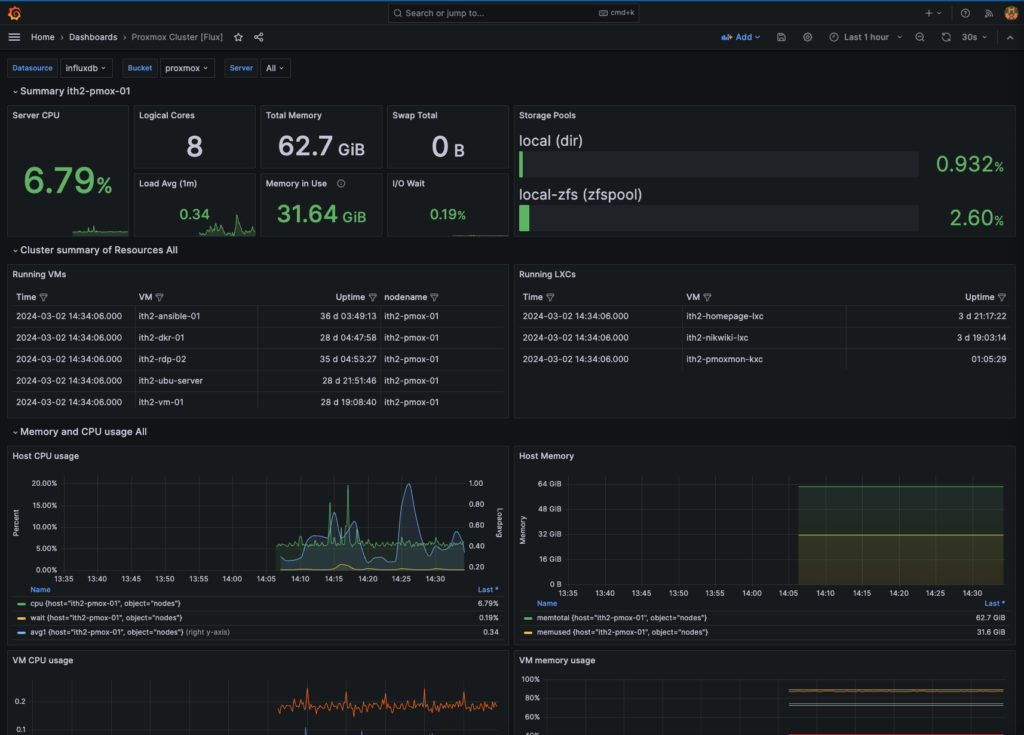
The dashboard is now setup and should be working now 🙂 Enjoy!
