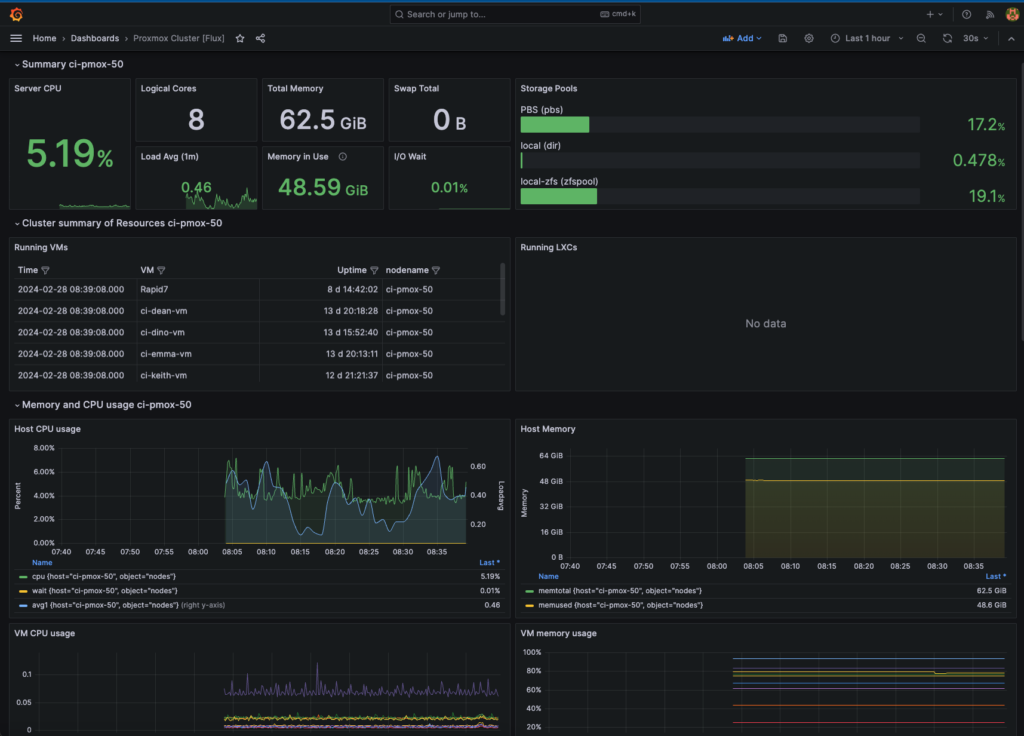
Proxmox Cluster Monitoring Dashboard with InfluxDB and Grafana (Production Solution)
Overview After Testing this Proxmox Cluster Monitoring Dashboard with InfluxDB and Grafana on a Docker Compose Container and finding it worked really well until the container was rebooted as it lost all its InfluxDB settings even though it was configured with persistent disks, I decided to create a new Proxmox LXC Ubuntu 22.04 container and […]
Proxmox Cluster Monitoring Dashboard with InfluxDB and Grafana (Production Solution) Read More »


